EDA: Vision Score and Win Condition
Using data collected through the Riot Games API, I perform a brief EDA of our data to search for insights.
Introduction
Welcome back! In our previous blog post, we discussed the importance of Vision Score in League of Legends and the steps we took to collect match data from Riot Games’ API. In this post, we will delve deeper into the data and present our findings after conducting some exploratory data analysis. We will explore various aspects of the data, such as the average Vision Score and win rate by team position and Vision cd 3 Score range. By the end of this blog post, we hope to provide valuable insights into the relationship between Vision Score and winning games, which can be beneficial for players looking to improve their chances of success in League of Legends. So let’s jump into the exciting world of data analysis and League of Legends!
Data Visualizations
Figure 1: Correlation Matrix
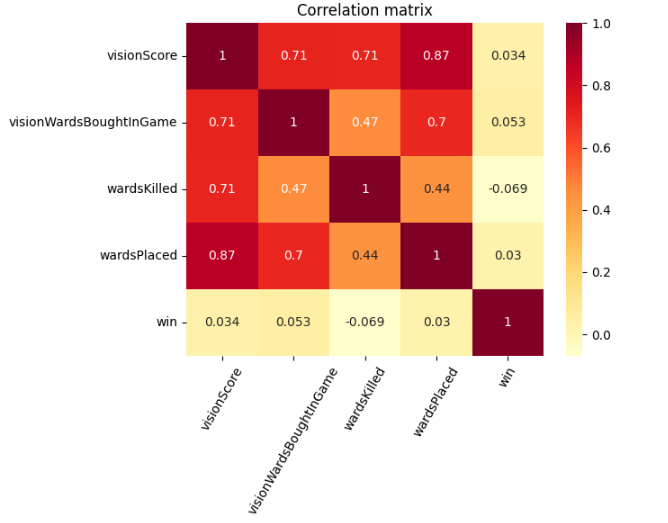
First off, I wanted to start with a correlation matrix to see if there was anything immediately unique about the data. Typically, vision score is good in games, so I was expecting each metric of vision to be positively associated with winning- however, you can see that the ‘wardsKilled’ metric is actually slightly negatively correlated with a win. My sample size is extremely small, but this still surprised me. I hypothesize that this could be because of players who prioritize taking down enemy wards even when they are not in a safe place, leading to a gank, a death, and gold for the enemy team.
Figure 2:
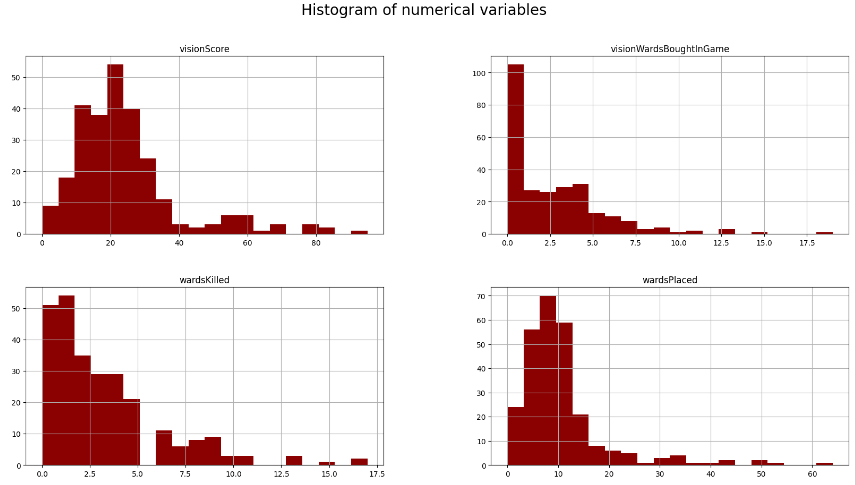
Next, I was interested in the counts of each variable and thought a visual representation would be nicer than a printed list of counts. This helps you to visualize what the vision score for a typical game might look like. For example, on the first axis, the ‘visionScore’ histogram, we can see a peak around 20, meaning that 20 was the vision score we saw in just over 50 of the matches recorded in the dataset. SImilarly, the number of wards bought in the game on the upper right axis, ‘visionWardsBoughtInGame’, there were over 100 games where the player did not buy any vision wards. I suspect that this is largely skewed by the amount of non-support (utility) roles that I included in my data, since vision is largely the responsiblity of the support (utility) player.
Figure 3:
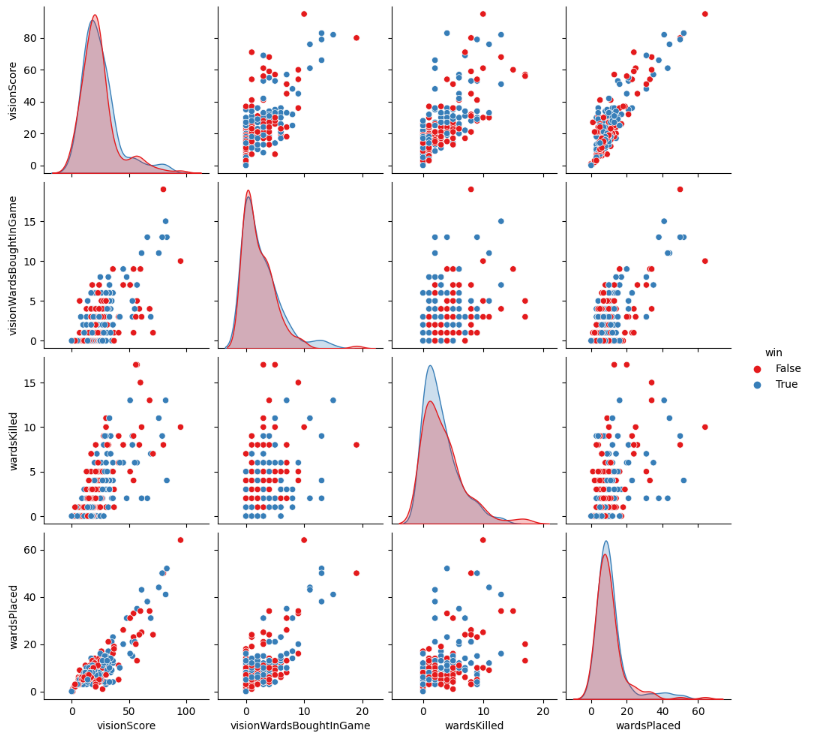
I wanted to make a pairplot and separate colors based off of wins and losses to see if there were any visual outliers between wins and losses for different vision metrics. This graph I didn’t find to be particularly useful by itself, although it is fun to look at.
Figure 4:
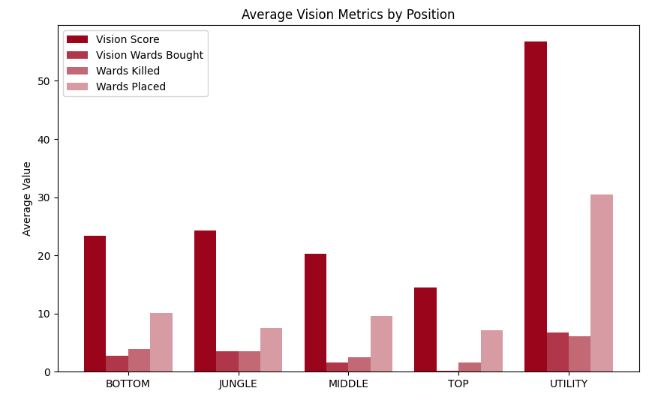
Here, I split up the vision metric across each position to see noticable differences between the roles. I include this with the hopes of helping those who do not play League of Legends, or any similar MOBA games, with an idea of the difference in vision between roles. Typically support (utility) leads the game in vision score, with Top lane having the least vision priority, compared to other roles.
Figure 5:
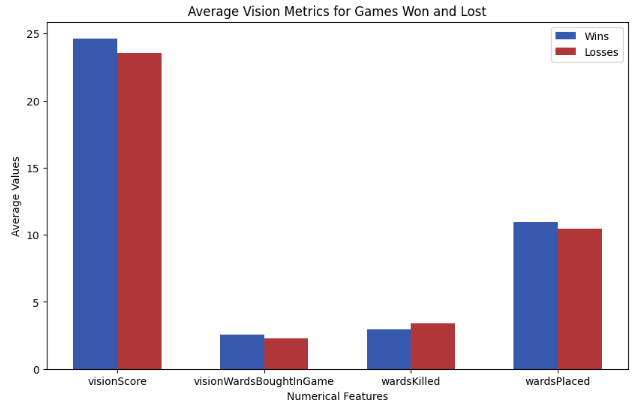
Here is a cut-and-dry visual of the average vision metrics of all the winning games, and all the losing games. We can see here once again that the more vision equals a better chance of winning, with the exception of the ‘wardsKilled’ variable.
Reflection
In this blog I shared a few graphs that give insight into the role vision plays in a match. Most of the information was information that I had expected to see just by my intuition of how the game works. That being said, I still uncovered some statistics that surprised me. If you have ideas to further my EDA, please leave your idea in a comment below!